CloudWatch
Introduction
- Metrics, Logs, Events, and Alarms
CloudWatch Metrics
- CloudWatch provides metrics for every service in AWS
- Metric is a variable to monitor (CPU Utilization, Network In, etc.)
- Metrics belong to namespaces
- Dimension is an attribute of a metric (instance id, environment, etc.)
- Up to 30 dimensions per metric
- Metrics have timestamp
- You can create dashboards of metrics
EC2 Detailed Monitoring
- By default, EC2 instance have metrics every 5 minutes
- If you enable detailed monitoring, you can get metrics every 1 minute``
- Use detailed monitoring if you want your ASG to scale faster
- The AWS Free tier allows us to have 10 detailed monitoring metrics
- EC2 memory usage is not pushed by default (you must push it from inside the instance as a custom metric)
CloudWatch Custom Metrics
- You can define your own custom metrics
- Use an API call
PutMetricData
CloudWatch Logs
- Define log groups, usually representing an application
- Log Stream: instances within application /log files/ containers
- You can define log expiration policies
- You can send CloudWatch logs to
- S3
- Kinesis Data Streams
- Kinesis Data Firehose
- AWS Lambda
- OpenSearch
- Logs are encrypted by default
Log Sources
-
SDK, CloudWatch Logs Agent, CloudWatch Unified Agent
-
BeanStalk: Collection of logs from the application
-
ECS: Collection from containers
-
AWS Lambda: collection from function logs
-
VPC Flow Log’s
-
API Gateway
-
CloudTrail based on a filter
-
Route53
-
Use CloudWatch Logs Insights to query logs
CloudWatch Logs Subscriptions
- Get a real-time log events from CloudWatch Logs for processing and analysis
- Send to Kinesis Data Streams, Kinesis Data Firehose, or Lambda
- Subscription Filter - filter which logs are events delivered to your destination
CloudWatch Alarms
- Trigger notifications from any metric
- Alarm States
- Ok
- Insufficient Data
- Alarm
- Targets
- Actions on EC2 instances
- Trigger autoscaling action
- Send notification to SNS service
- Composite Alarms monitor the state of multiple other alarms
- AND and OR conditions
CloudWatch Synthetics Canary
- Configurable script that can monitor your APIs, URLs, Websites, etc.
- Reproduce what your customers do programmatically to find issues before customers are impacted
- Blueprints
- Heartbeat Monitor
- API Canary
- Broken Link Checker
- Visual Monitoring
- Canary Recorder
- GUI Workflow Builder
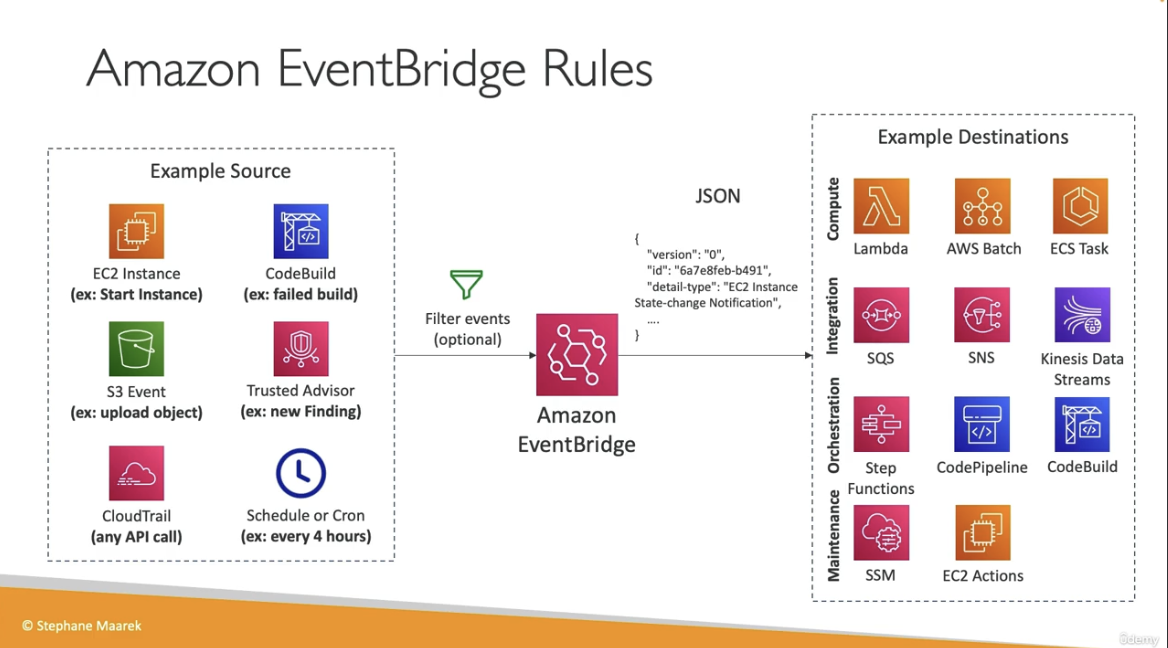
Amazon Event Bridge
-
React to events. Examples:
- EC2 Instance started
- Codebuild failed build
- S3 upload object
- schedule a cronjob
- CloudTrail API call
- Event Buses can be accessed across AWS accounts using Resource-Based Policies
- Resource policies allow you to manage permissions for an EventBus