Network Watcher
Introduction
Network Watcher is a collection of tools used to monitor and diagnose network connectivity in Azure. It focuses on monitoring the network health of IaaS services in Azure. Network Watcher is not suitable for monitoring PaaS services or performing web analytics. The tools in Network Watcher fall into two main categories - network monitoring and network diagnostics.
Network Monitor is a regional service which means we must create a Network Watcher in each region we want to monitor. Network Watcher is not enabled by default and must be enabled in each region we want to monitor.
Tools
Network Monitoring Tools
Topology
- The Topology tool provides a visual representation of the network resources in a subscription. The tool shows the resources in a subscription and the connections between them. The Topology tool can be used to understand the network architecture of a subscription, identify network security groups, and troubleshoot network connectivity issues.
- The only requirements is to have a Network Watcher resource enabled in the same region as the vNet for which you want to create a topology map.
- There is no additional cost for using the Topology Map.
Connection Monitor
- Continuously monitor the connection between two endpoints.
- Connection Monitor relies on agents that are installed on source endpoints to perform connectivity tests and collect data related to connection health. The agent simulates network traffic between source and destination to measure key metrics, such as latency.
- The agent to install on the source endpoint depends on whether the source VM is running in Azure or on-premises. For Azure VMs, we can install the Network Watcher extension. For on-prem VMs, we can install the Azure Monitor Agent (AMA).
- Stores results in Log Analytics
- Connectivity checks can use HTTP, TCP, or ICMP
Network Diagnostics Tools
IP Flow Verify
- Network Watcher IP flow verify checks if a packet is allowed or denied from a virtual machine based on 5-tuple information. The security group decision and the name of the rule that denied the packet will be returned
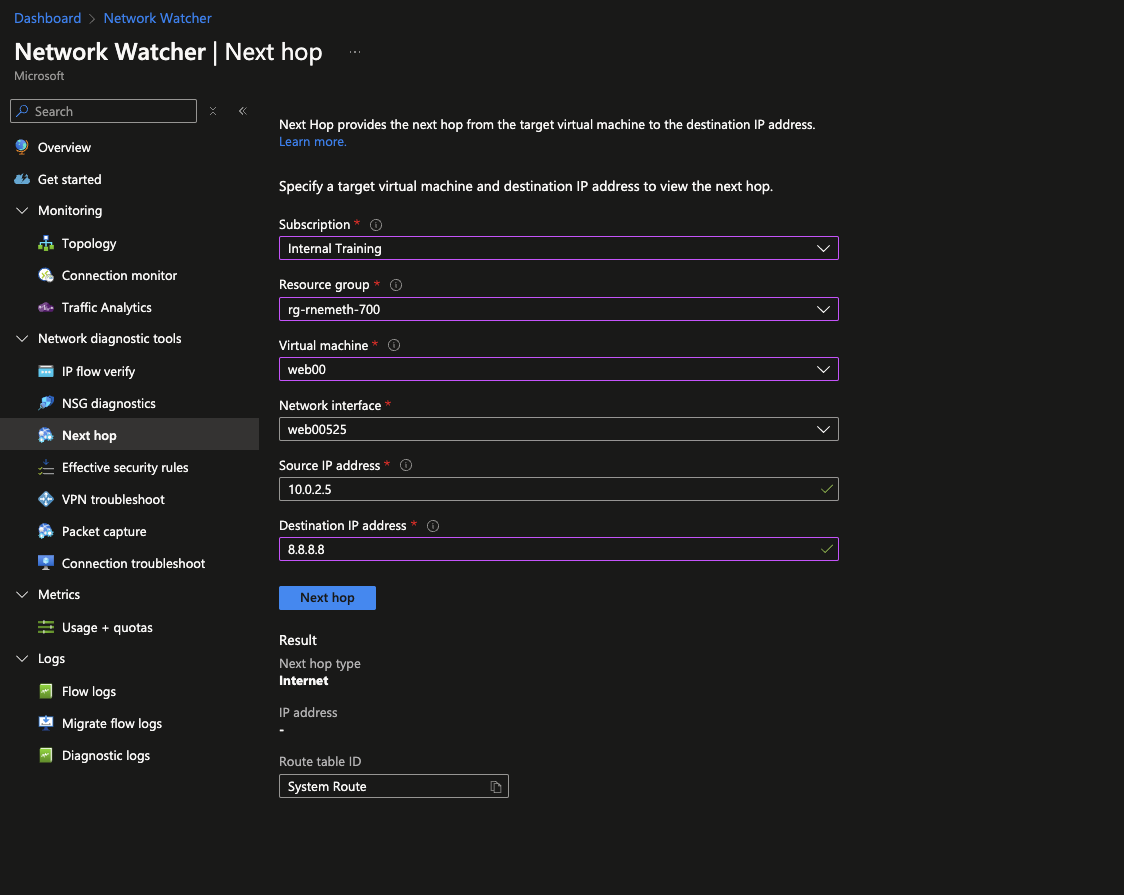
Next Hop
- Next Hop provides the next hop from the target virtual machine to the destination IP address.
Connection Troubleshoot
- Available from the
Network Watcherblade or from the VirtualMachineblade - Similar to Connection Monitor, but allows you to monitor the connection between a VM and a destination IP address on-demand, rather than continuously
- Can be used to check if a port is open at a destination
- Only supports ICMP and TCP
- If the endpoint to test is an Azure VM or VMSS instance, you need to install the Network Watcher extension.
Componenents
- Source Types:
- VM / VMSS
- App Gateway
- Bastion Host
- Destionation Types:
- Virtual Machine
- IP Address
- You can choose to use IPv4 or IPv6, or both
- You then specify the source and destination ports
- You can also specify the protocol to use (TCP or ICMP
- Finally, you choose the type of Diagnostic Test to run:
- Connectivity Test
- Next Hop
- NSG Diagnostic
- Port Scanner
NSG Diagnostics
- The Network Security Group Diagnostics tool provides detailed information to understand and debug the security configuration of your network. For a given source-destination pair, network security group diagnostics returns all network security groups that will be traversed, the rules that will be applied in each network security group, and the final allow/deny status for the flow.
- The tool can be used to troubleshoot connectivity issues, understand the rules that are applied to a flow, and verify that the rules are correct.
NSG Flow Logs
- NSG Flow Logs are a feature of Network Watcher that allows you to view information about ingress and egress IP traffic through a Network Security Group. The logs are stored in a storage account and can be viewed in the Azure portal or downloaded for further analysis.
Packet Capture
- Packet capture allows you to create packet capture sessions to track traffic to and from a virtual machine. You can create a packet capture session on a VM, VMSS, or network interface. The packet capture session will capture all network traffic to and from the virtual machine or network interface. You can then download the packet capture file and analyze it using a network protocol analyzer.